








News
Why Banks Should Employ Deep Peer Intelligence
Many banks look at call report data for benchmarking, but they’re missing an opportunity to add more context.
The peer group comparison set defines success. Boards should understand which other banks are in their peer group set and more importantly, why.
Whom do you consider to be your bank’s peers, and why?
Most community banks look at asset size and geography. Benchmark reviews come from the Uniform Bank Performance Report (UBPR), where peer groups are national and based on asset size. The group for commercial banks with $300 million to $1 billion in assets holds about 1,300 banks. Most directors couldn’t name a dozen of them.
That matters because the peer group is the measuring stick. Nearly every conclusion a board draws from peer data depends on the comparative set. A bank measured against slower-growing banks in its own state can look healthy on metrics that a group of more ambitious peers would flag.
There is no rule that says you are only allowed to have one list of peers. Let’s assume your top five key metrics are return on equity, asset growth, efficiency ratio, net interest margin and Tier 1 capital. Make a group of the top seven performers in each category. Also, look at the trend for each of these numbers over the past five quarters.
Notice which banks show up multiple times and ask yourself what they have in common and how they differ from you. The objective is not to produce a report just to say you did. Rather, you are looking for trends, insights and actions that will improve your performance.
With this, you align your priorities for evaluation with others, establish the current trend and refine who are the true top performers.
Banking is a business won street by street and town by town. To that end, consider adding filters for local, statewide and multi-state views of the information we noted here. These are non-negotiables for analysis. Too many banks never get that far.
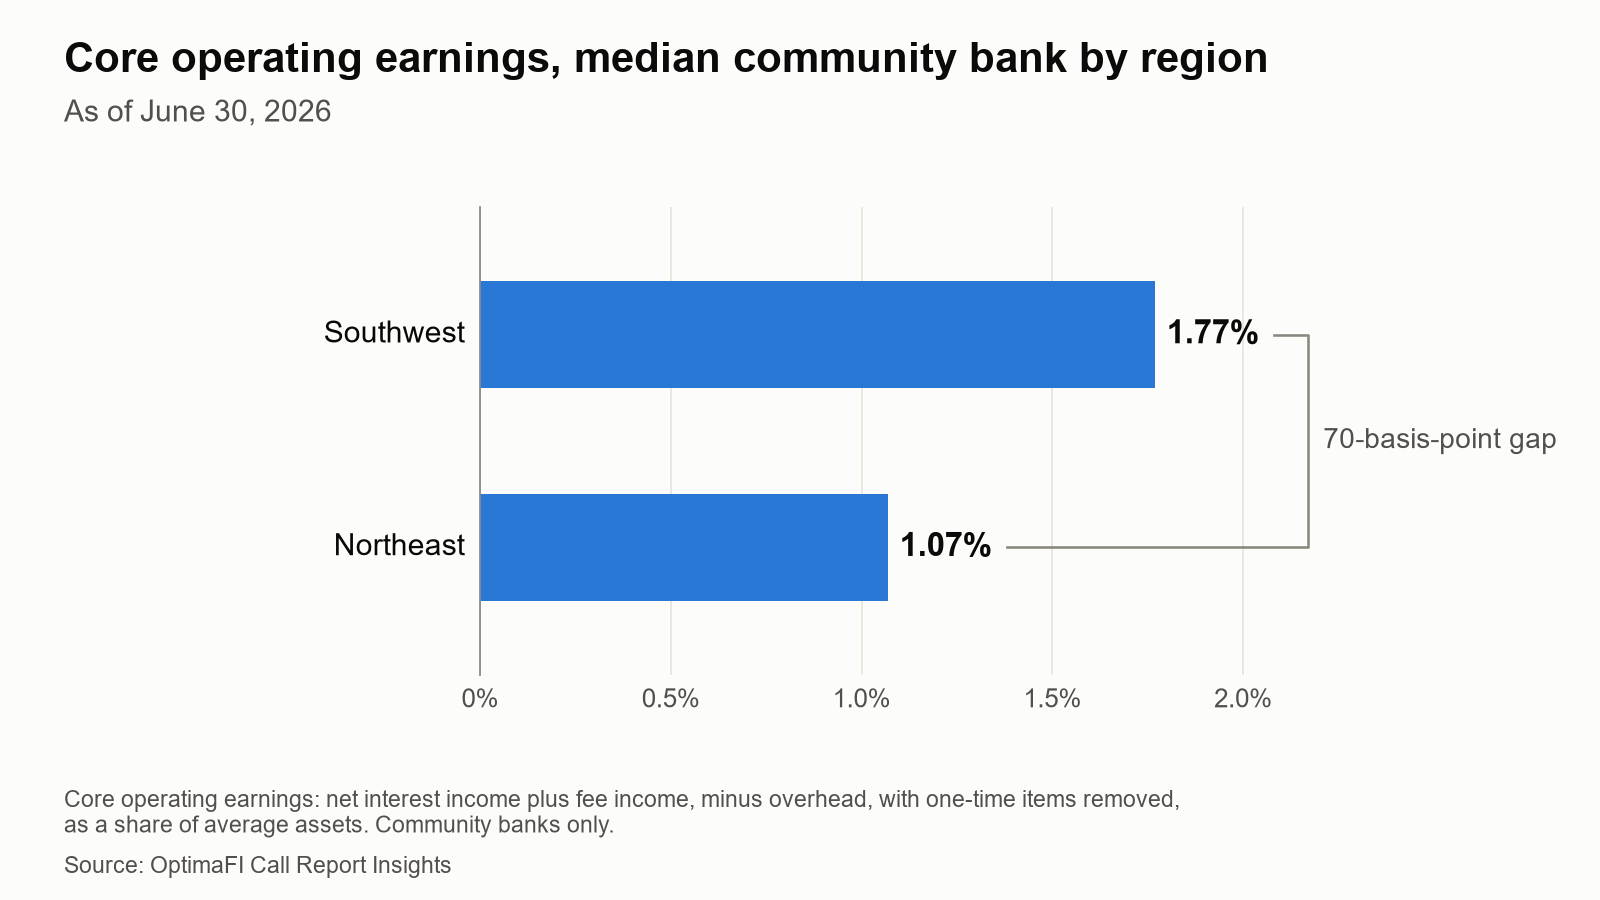
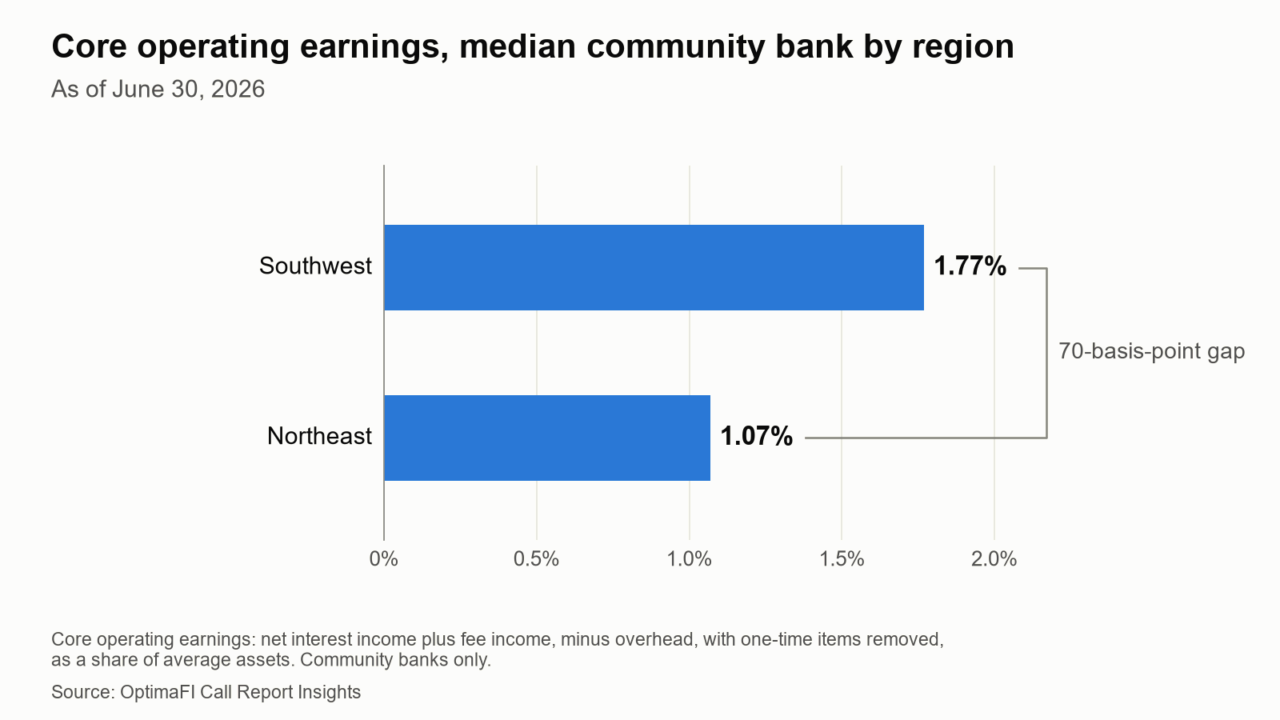
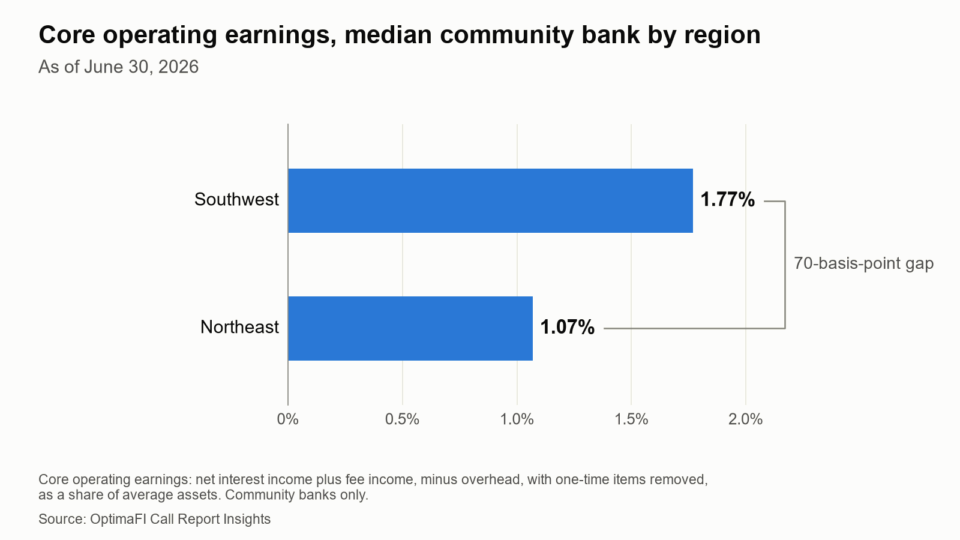
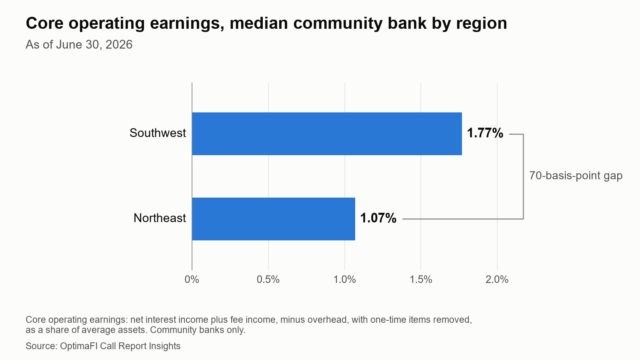
Take core operating earnings: net interest income plus fee income, minus overhead, with one-time items removed. As of June 30, 2026, call report data show the median Southwest community bank earned 1.77% of average assets on that basis. The median Northeast bank earned 1.07%. That’s a 70-basis point gap before anyone looks at how either bank is run.
Part of it is loan mix. Northeast banks hold more lower-yielding 1-4 family mortgages and fewer consumer loans than any other region. They also had far lighter losses in the last credit cycle, and examiners have let them carry smaller reserves since. Together, these factors explain why a national peer group would mislead a Northeast board.
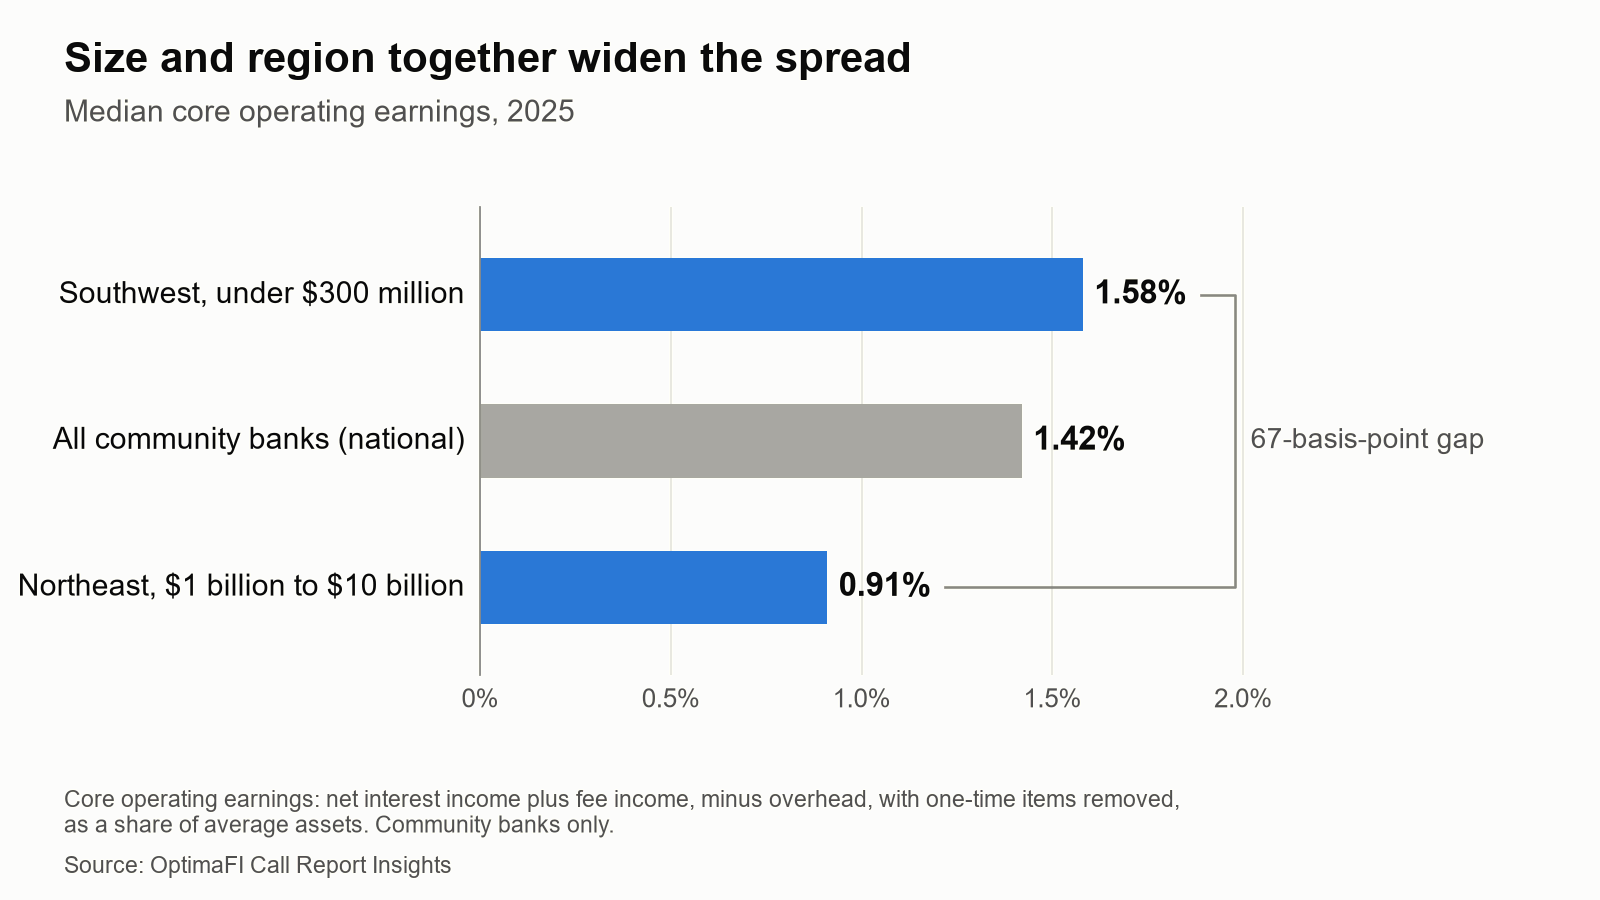
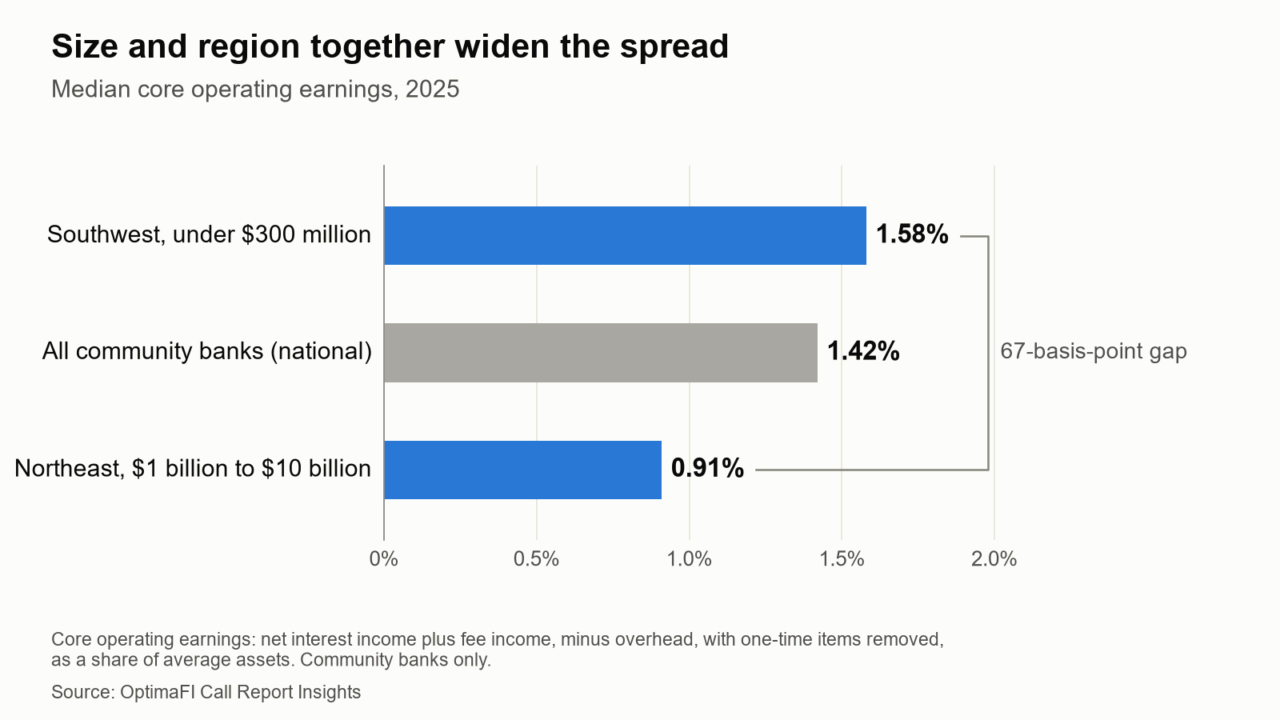
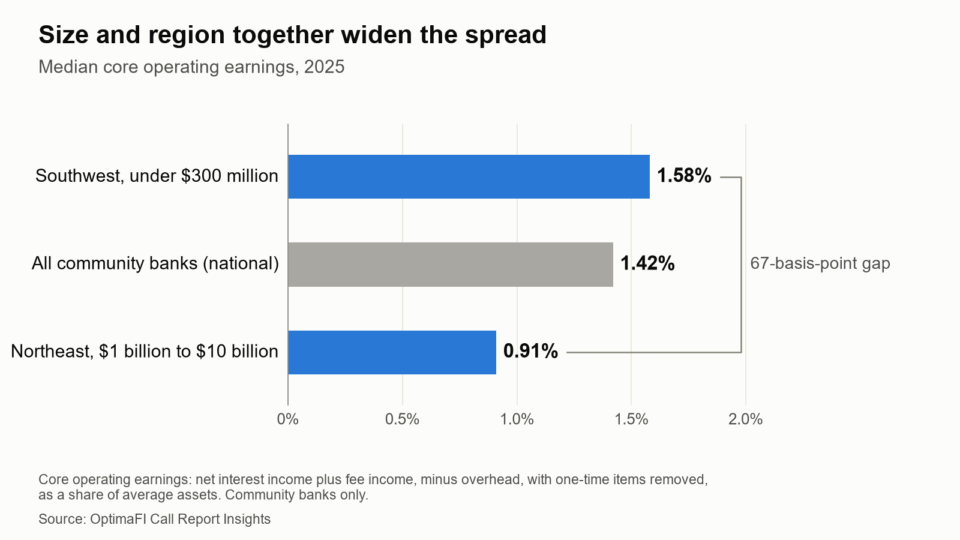
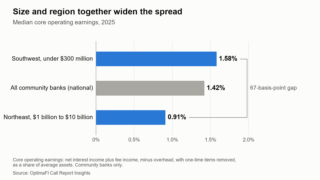
Size adds another layer. In 2025, the median core operating earnings, as a share of average assets, for Southwest banks under $300 million was 1.58%, while Northeast banks with $1 billion to $10 billion came in at 0.91%. The national community bank median was 1.42%. Comparing a large Northeast bank to a national group is like comparing apples to oranges.
The last step in the process is as important as any other part. Knowing how to talk about the right peer group depends on who’s reading the analysis:
Once you have the right peers, the metrics are easy. Tailor the breadth and depth for each, and don’t be afraid to say no when the inevitable scope creep kicks in. There is more value in consistency than in complexity. This is something your teams will come to accept and expect.
This article was originally published on BankDirector.

Many banks look at call report data for benchmarking, but they’re missing an opportunity to add more context.
OptimaFI’s Household Insights, a new tool giving credit unions and community banks household-level account intelligence, was one of 72 live demos on stage at FinovateFall 2026.
Household Insights gives community banks and credit unions a true picture of their household relationships, not just accounts...